Welcome to KLH Peer Mentors World

Let's Study:-
CO1:
What is a Data Warehouse?
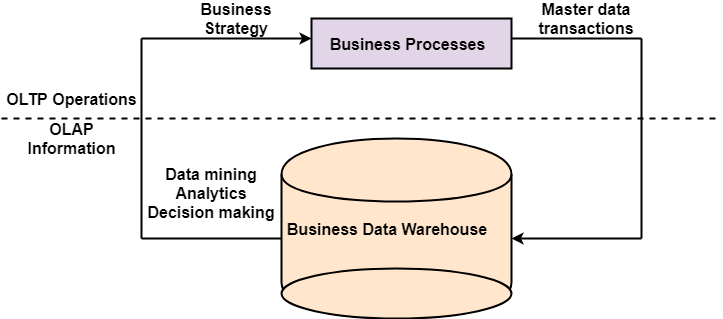
A Data Warehouse (DW) is a relational database that is designed for query and analysis rather than transaction processing. It includes historical data derived from transaction data from single and multiple sources.
A Data Warehouse provides integrated, enterprise-wide, historical data and focuses on providing support for decision-makers for data modeling and analysis.
Let's understand through this vedio 👇👇👇👇👇
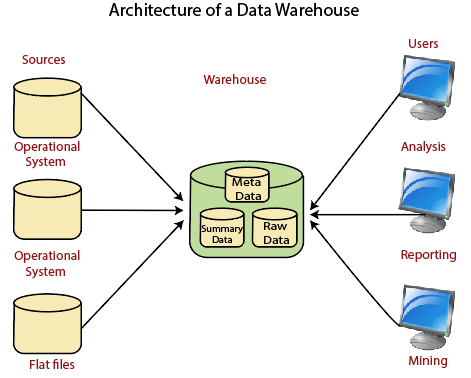
Data Warehouse Architecture
A data warehouse architecture is a method of defining the overall architecture of data communication processing and presentation that exist for end-clients computing within the enterprise. Each data warehouse is different, but all are characterized by standard vital components.
Production applications such as payroll accounts payable product purchasing and inventory control are designed for online transaction processing (OLTP). Such applications gather detailed data from day to day operations.
Data Warehouse applications are designed to support the user ad-hoc data requirements, an activity recently dubbed online analytical processing (OLAP). These include applications such as forecasting, profiling, summary reporting, and trend analysis.
Production databases are updated continuously by either by hand or via OLTP applications. In contrast, a warehouse database is updated from operational systems periodically, usually during off-hours. As OLTP data accumulates in production databases, it is regularly extracted, filtered, and then loaded into a dedicated warehouse server that is accessible to users. As the warehouse is populated, it must be restructured tables de-normalized, data cleansed of errors and redundancies and new fields and keys added to reflect the needs to the user for sorting, combining, and summarizing data.
ETL (Extract, Transform, and Load) Process
What is ETL?
The mechanism of extracting information from source systems and bringing it into the data warehouse is commonly called ETL, which stands for Extraction, Transformation and Loading.
The ETL process requires active inputs from various stakeholders, including developers, analysts, testers, top executives and is technically challenging.
To maintain its value as a tool for decision-makers, Data warehouse technique needs to change with business changes. ETL is a recurring method (daily, weekly, monthly) of a Data warehouse system and needs to be agile, automated, and well documented.
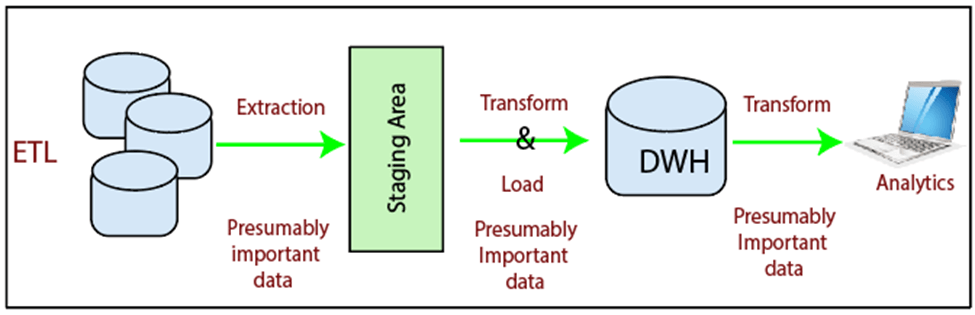
How ETL Works?
ETL consists of three separate phases:
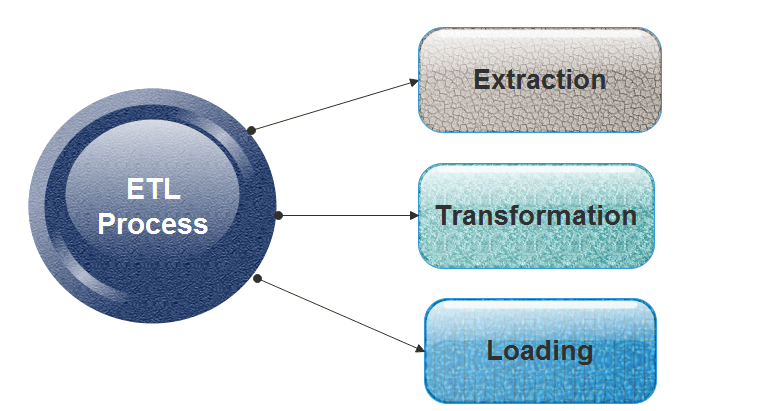
Extraction
- Extraction is the operation of extracting information from a source system for further use in a data warehouse environment. This is the first stage of the ETL process.
- Extraction process is often one of the most time-consuming tasks in the ETL.
- The source systems might be complicated and poorly documented, and thus determining which data needs to be extracted can be difficult.
- The data has to be extracted several times in a periodic manner to supply all changed data to the warehouse and keep it up-to-date.
Cleansing
The cleansing stage is crucial in a data warehouse technique because it is supposed to improve data quality. The primary data cleansing features found in ETL tools are rectification and homogenization. They use specific dictionaries to rectify typing mistakes and to recognize synonyms, as well as rule-based cleansing to enforce domain-specific rules and defines appropriate associations between values.
The following examples show the essential of data cleaning:
If an enterprise wishes to contact its users or its suppliers, a complete, accurate and up-to-date list of contact addresses, email addresses and telephone numbers must be available.
If a client or supplier calls, the staff responding should be quickly able to find the person in the enterprise database, but this need that the caller's name or his/her company name is listed in the database.
If a user appears in the databases with two or more slightly different names or different account numbers, it becomes difficult to update the customer's information.
Transformation
Transformation is the core of the reconciliation phase. It converts records from its operational source format into a particular data warehouse format. If we implement a three-layer architecture, this phase outputs our reconciled data layer.
The following points must be rectified in this phase:
- Loose texts may hide valuable information. For example, XYZ PVT Ltd does not explicitly show that this is a Limited Partnership company.
- Different formats can be used for individual data. For example, data can be saved as a string or as three integers.
- Conversion and normalization that operate on both storage formats and units of measure to make data uniform.
- Matching that associates equivalent fields in different sources.
- Selection that reduces the number of source fields and records.
- Refresh: Data Warehouse data is completely rewritten. This means that older file is replaced. Refresh is usually used in combination with static extraction to populate a data warehouse initially.
- Update: Only those changes applied to source information are added to the Data Warehouse. An update is typically carried out without deleting or modifying preexisting data. This method is used in combination with incremental extraction to update data warehouses regularly.
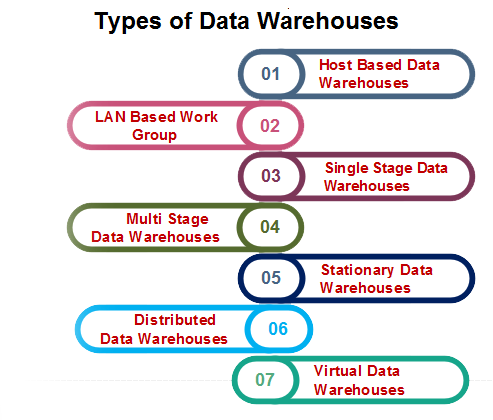
Types of Data Warehouses
There are different types of data warehouses, which are as follows:
Cleansing and Transformation processes are often closely linked in ETL tools.
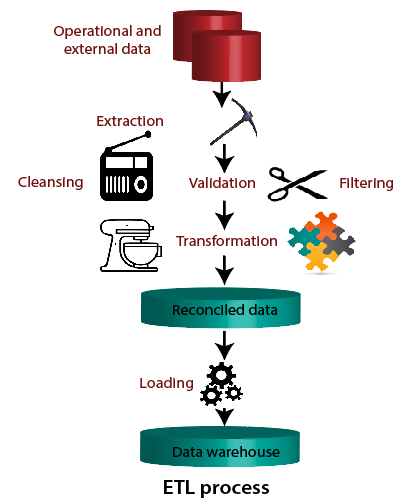
Loading
The Load is the process of writing the data into the target database. During the load step, it is necessary to ensure that the load is performed correctly and with as little resources as possible.
Loading can be carried in two ways:
Data Warehouse Design:
A data warehouse is a single data repository where a record from multiple data sources is integrated for online business analytical processing (OLAP). This implies a data warehouse needs to meet the requirements from all the business stages within the entire organization. Thus, data warehouse design is a hugely complex, lengthy, and hence error-prone process. Furthermore, business analytical functions change over time, which results in changes in the requirements for the systems. Therefore, data warehouse and OLAP systems are dynamic, and the design process is continuous.
There are two approaches
- "top-down" approach
- "bottom-up" approach
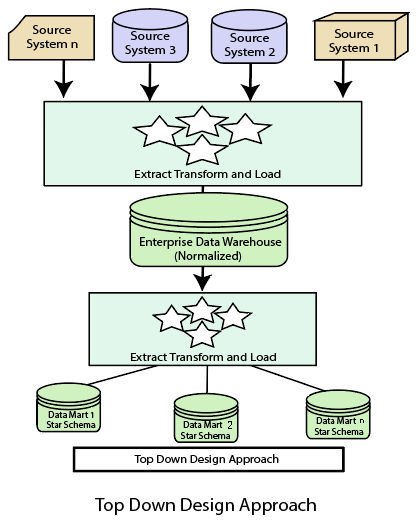
Top-down Design Approach
In the "Top-Down" design approach, a data warehouse is described as a subject-oriented, time-variant, non-volatile and integrated data repository for the entire enterprise data from different sources are validated, reformatted and saved in a normalized (up to 3NF) database as the data warehouse.
Advantages of top-down design
Data Marts are loaded from the data warehouses.
Developing new data mart from the data warehouse is very easy.
Disadvantages of top-down design
This technique is inflexible to changing departmental needs.
The cost of implementing the project is high.
Bottom-Up Design Approach
In the "Bottom-Up" approach, a data warehouse is described as "a copy of transaction data specifical architecture for query and analysis," term the star schema. In this approach, a data mart is created first to necessary reporting and analytical capabilities for particular business processes (or subjects). Thus it is needed to be a business-driven approach in contrast to Inmon's data-driven approach.
Differentiate between Top-Down Design Approach and Bottom-Up Design Approach
| Top-Down Design Approach | Bottom-Up Design Approach |
|---|---|
| Breaks the vast problem into smaller subproblems. | Solves the essential low-level problem and integrates them into a higher one. |
| Inherently architected- not a union of several data marts. | Inherently incremental; can schedule essential data marts first. |
| Single, central storage of information about the content. | Departmental information stored. |
| Centralized rules and control. | Departmental rules and control. |
| It includes redundant information. | Redundancy can be removed. |
| It may see quick results if implemented with repetitions. | Less risk of failure, favorable return on investment, and proof of techniques. |
What is OLAP (Online Analytical Processing)?
OLAP stands for On-Line Analytical Processing. OLAP is a classification of software technology which authorizes analysts, managers, and executives to gain insight into information through fast, consistent, interactive access in a wide variety of possible views of data that has been transformed from raw information to reflect the real dimensionality of the enterprise as understood by the clients.
OLAP implement the multidimensional analysis of business information and support the capability for complex estimations, trend analysis, and sophisticated data modeling. It is rapidly enhancing the essential foundation for Intelligent Solutions containing Business Performance Management, Planning, Budgeting, Forecasting, Financial Documenting, Analysis, Simulation-Models, Knowledge Discovery, and Data Warehouses Reporting. OLAP enables end-clients to perform ad hoc analysis of record in multiple dimensions, providing the insight and understanding they require for better decision making.
Who uses OLAP and Why?
OLAP applications are used by a variety of the functions of an organization.
How OLAP Works?
Fundamentally, OLAP has a very simple concept. It pre-calculates most of the queries that are typically very hard to execute over tabular databases, namely aggregation, joining, and grouping. These queries are calculated during a process that is usually called 'building' or 'processing' of the OLAP cube. This process happens overnight, and by the time end users get to work - data will have been updated.
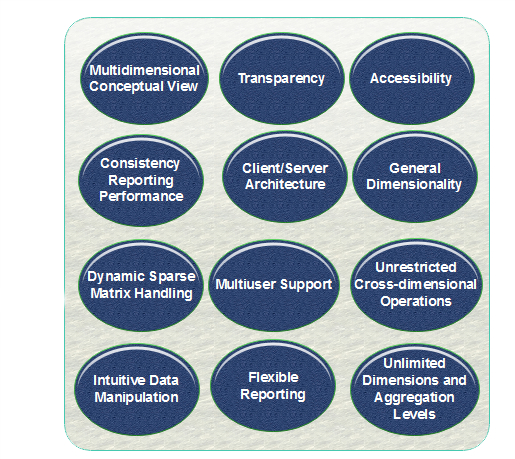
OLAP Guidelines (Dr.E.F.Codd Rule)
Dr E.F. Codd, the "father" of the relational model, has formulated a list of 12 guidelines and requirements as the basis for selecting OLAP systems:
Characteristics of OLAP
In the FASMI characteristics of OLAP methods, the term derived from the first letters of the characteristics are:
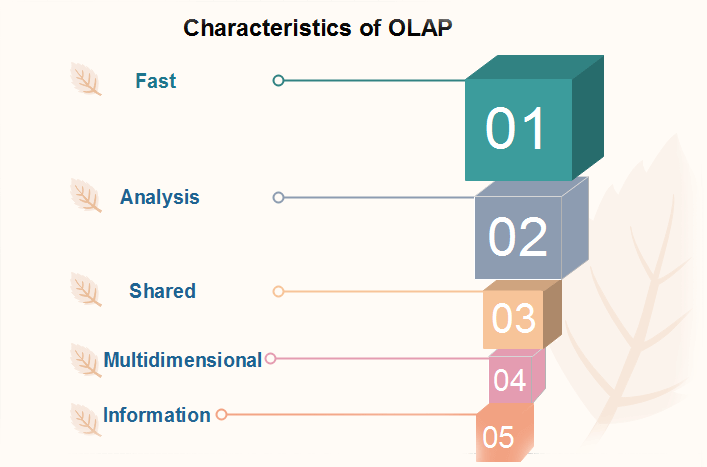
Fast
It defines which the system targeted to deliver the most feedback to the client within about five seconds, with the elementary analysis taking no more than one second and very few taking more than 20 seconds.
Analysis
It defines which the method can cope with any business logic and statistical analysis that is relevant for the function and the user, keep it easy enough for the target client. Although some preprogramming may be needed we do not think it acceptable if all application definitions have to be allow the user to define new Adhoc calculations as part of the analysis and to document on the data in any desired method, without having to program so we excludes products (like Oracle Discoverer) that do not allow the user to define new Adhoc calculation as part of the analysis and to document on the data in any desired product that do not allow adequate end user-oriented calculation flexibility.
Share
It defines which the system tools all the security requirements for understanding and, if multiple write connection is needed, concurrent update location at an appropriated level, not all functions need customer to write data back, but for the increasing number which does, the system should be able to manage multiple updates in a timely, secure manner.
Multidimensional
This is the basic requirement. OLAP system must provide a multidimensional conceptual view of the data, including full support for hierarchies, as this is certainly the most logical method to analyze business and organizations.
Information
The system should be able to hold all the data needed by the applications. Data sparsity should be handled in an efficient manner.
The main characteristics of OLAP are as follows:
- Multidimensional conceptual view: OLAP systems let business users have a dimensional and logical view of the data in the data warehouse. It helps in carrying slice and dice operations.
- Multi-User Support: Since the OLAP techniques are shared, the OLAP operation should provide normal database operations, containing retrieval, update, adequacy control, integrity, and security.
- Accessibility: OLAP acts as a mediator between data warehouses and front-end. The OLAP operations should be sitting between data sources (e.g., data warehouses) and an OLAP front-end.
- Storing OLAP results: OLAP results are kept separate from data sources.
- Uniform documenting performance: Increasing the number of dimensions or database size should not significantly degrade the reporting performance of the OLAP system.
- OLAP provides for distinguishing between zero values and missing values so that aggregates are computed correctly.
- OLAP system should ignore all missing values and compute correct aggregate values.
- OLAP facilitate interactive query and complex analysis for the users.
- OLAP allows users to drill down for greater details or roll up for aggregations of metrics along a single business dimension or across multiple dimension.
- OLAP provides the ability to perform intricate calculations and comparisons.
- OLAP presents results in a number of meaningful ways, including charts and graphs.
Benefits of OLAP
OLAP holds several benefits for businesses: -
- OLAP helps managers in decision-making through the multidimensional record views that it is efficient in providing, thus increasing their productivity.
- OLAP functions are self-sufficient owing to the inherent flexibility support to the organized databases.
- It facilitates simulation of business models and problems, through extensive management of analysis-capabilities.
- In conjunction with data warehouse, OLAP can be used to support a reduction in the application backlog, faster data retrieval, and reduction in query drag.
Motivations for using OLAP
1) Understanding and improving sales: For enterprises that have much products and benefit a number of channels for selling the product, OLAP can help in finding the most suitable products and the most famous channels. In some methods, it may be feasible to find the most profitable users. For example, considering the telecommunication industry and considering only one product, communication minutes, there is a high amount of record if a company want to analyze the sales of products for every hour of the day (24 hours), difference between weekdays and weekends (2 values) and split regions to which calls are made into 50 region.
2) Understanding and decreasing costs of doing business: Improving sales is one method of improving a business, the other method is to analyze cost and to control them as much as suitable without affecting sales. OLAP can assist in analyzing the costs related to sales. In some methods, it may also be feasible to identify expenditures which produce a high return on investments (ROI). For example, recruiting a top salesperson may contain high costs, but the revenue generated by the salesperson may justify the investment.
Difference between OLTP and OLAP
OLTP (On-Line Transaction Processing) is featured by a large number of short on-line transactions (INSERT, UPDATE, and DELETE). The primary significance of OLTP operations is put on very rapid query processing, maintaining record integrity in multi-access environments, and effectiveness consistent by the number of transactions per second. In the OLTP database, there is an accurate and current record, and schema used to save transactional database is the entity model (usually 3NF).
OLAP (On-line Analytical Processing) is represented by a relatively low volume of transactions. Queries are very difficult and involve aggregations. For OLAP operations, response time is an effectiveness measure. OLAP applications are generally used by Data Mining techniques. In OLAP database there is aggregated, historical information, stored in multi-dimensional schemas (generally star schema).
Following are the difference between OLAP and OLTP system.
1) Users: OLTP systems are designed for office worker while the OLAP systems are designed for decision-makers. Therefore while an OLTP method may be accessed by hundreds or even thousands of clients in a huge enterprise, an OLAP system is suitable to be accessed only by a select class of manager and may be used only by dozens of users.
2) Functions: OLTP systems are mission-critical. They provide day-to-day operations of an enterprise and are largely performance and availability driven. These operations carry out simple repetitive operations. OLAP systems are management-critical to support the decision of enterprise support tasks using detailed investigation.
3) Nature: Although SQL queries return a set of data, OLTP methods are designed to step one record at the time, for example, a data related to the user who may be on the phone or in the store. OLAP system is not designed to deal with individual customer records. Instead, they include queries that deal with many data at a time and provide summary or aggregate information to a manager. OLAP applications include data stored in a data warehouses that have been extracted from many tables and possibly from more than one enterprise database.
4) Design: OLTP database operations are designed to be application-oriented while OLAP operations are designed to be subject-oriented. OLTP systems view the enterprise record as a collection of tables (possibly based on an entity-relationship model). OLAP operations view enterprise information as multidimensional).
5) Data: OLTP systems usually deal only with the current status of data. For example, a record about an employee who left three years ago may not be feasible on the Human Resources System. The old data may have been achieved on some type of stable storage media and may not be accessible online. On the other hand, OLAP systems needed historical data over several years since trends are often essential in decision making.
6) Kind of use: OLTP methods are used for reading and writing operations while OLAP methods usually do not update the data.
7) View: An OLTP system focuses primarily on the current data within an enterprise or department, which does not refer to historical data or data in various organizations. In contrast, an OLAP system spans multiple version of a database schema, due to the evolutionary process of an organization. OLAP system also deals with information that originates from different organizations, integrating information from many data stores. Because of their huge volume, these are stored on multiple storage media.
8) Access Patterns: The access pattern of an OLTP system consist primarily of short, atomic transactions. Such a system needed concurrency control and recovery techniques. However, access to OLAP systems is mostly read-only operations because these data warehouses store historical information.
The biggest difference between an OLTP and OLAP system is the amount of data analyzed in a single transaction. Whereas an OLTP handles many concurrent customers and queries touching only a single data or limited collection of records at a time, an OLAP system must have the efficiency to operate on millions of data to answer a single query.
What is Dimensional Modeling?
Dimensional modeling represents data with a cube operation, making more suitable logical data representation with OLAP data management. The perception of Dimensional Modeling was developed by Ralph Kimball and is consist of "fact" and "dimension" tables.
In dimensional modeling, the transaction record is divided into either "facts," which are frequently numerical transaction data, or "dimensions," which are the reference information that gives context to the facts. For example, a sale transaction can be damage into facts such as the number of products ordered and the price paid for the products, and into dimensions such as order date, user name, product number, order ship-to, and bill-to locations, and salesman responsible for receiving the order.
Objectives of Dimensional Modeling
The purposes of dimensional modeling are:
- To produce database architecture that is easy for end-clients to understand and write queries.
- To maximize the efficiency of queries. It achieves these goals by minimizing the number of tables and relationships between them.
Advantages of Dimensional Modeling
Following are the benefits of dimensional modeling are:
Dimensional modeling is simple: Dimensional modeling methods make it possible for warehouse designers to create database schemas that business customers can easily hold and comprehend. There is no need for vast training on how to read diagrams, and there is no complicated relationship between different data elements.
Dimensional modeling promotes data quality: The star schema enable warehouse administrators to enforce referential integrity checks on the data warehouse. Since the fact information key is a concatenation of the essentials of its associated dimensions, a factual record is actively loaded if the corresponding dimensions records are duly described and also exist in the database.
By enforcing foreign key constraints as a form of referential integrity check, data warehouse DBAs add a line of defense against corrupted warehouses data.
Performance optimization is possible through aggregates: As the size of the data warehouse increases, performance optimization develops into a pressing concern. Customers who have to wait for hours to get a response to a query will quickly become discouraged with the warehouses. Aggregates are one of the easiest methods by which query performance can be optimized.
Disadvantages of Dimensional Modeling
- To maintain the integrity of fact and dimensions, loading the data warehouses with a record from various operational systems is complicated.
- It is severe to modify the data warehouse operation if the organization adopting the dimensional technique changes the method in which it does business.
Elements of Dimensional Modeling
Fact
It is a collection of associated data items, consisting of measures and context data. It typically represents business items or business transactions.
Dimensions
It is a collection of data which describe one business dimension. Dimensions decide the contextual background for the facts, and they are the framework over which OLAP is performed.
Measure
It is a numeric attribute of a fact, representing the performance or behavior of the business relative to the dimensions.
Considering the relational context, there are two basic models which are used in dimensional modeling:
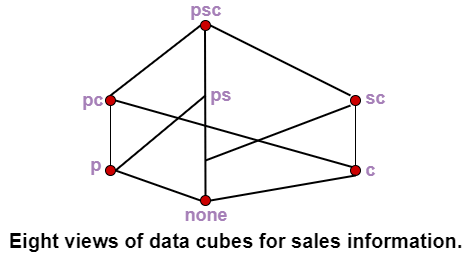
What is Data Cube?
When data is grouped or combined in multidimensional matrices called Data Cubes. The data cube method has a few alternative names or a few variants, such as "Multidimensional databases," "materialized views," and "OLAP (On-Line Analytical Processing)."
The general idea of this approach is to materialize certain expensive computations that are frequently inquired.
For example, a relation with the schema sales (part, supplier, customer, and sale-price) can be materialized into a set of eight views as shown in fig, where psc indicates a view consisting of aggregate function value (such as total-sales) computed by grouping three attributes part, supplier, and customer, p indicates a view composed of the corresponding aggregate function values calculated by grouping part alone, etc.
A data cube is created from a subset of attributes in the database. Specific attributes are chosen to be measure attributes, i.e., the attributes whose values are of interest. Another attributes are selected as dimensions or functional attributes. The measure attributes are aggregated according to the dimensions.
A data cube enables data to be modeled and viewed in multiple dimensions. A multidimensional data model is organized around a central theme, like sales and transactions. A fact table represents this theme. Facts are numerical measures. Thus, the fact table contains measure (such as Rs_sold) and keys to each of the related dimensional tables.
Dimensions are a fact that defines a data cube. Facts are generally quantities, which are used for analyzing the relationship between dimensions.

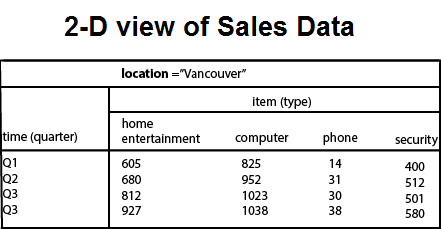
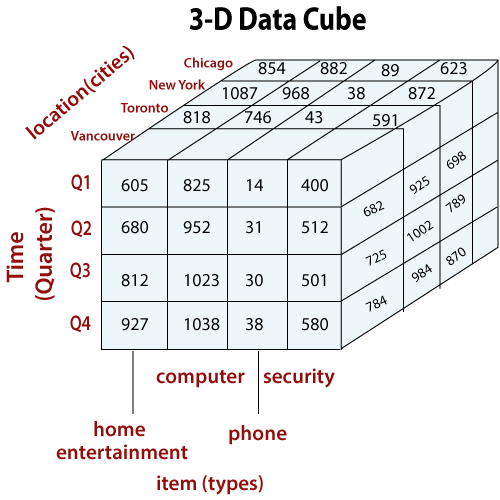
Example: In the 2-D representation, we will look at the All Electronics sales data for items sold per quarter in the city of Vancouver. The measured display in dollars sold (in thousands).
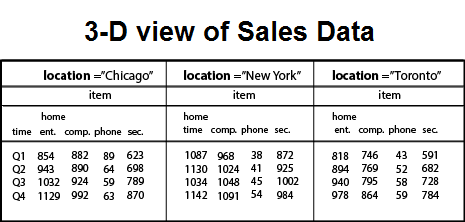
3-Dimensional Cuboids
Let suppose we would like to view the sales data with a third dimension. For example, suppose we would like to view the data according to time, item as well as the location for the cities Chicago, New York, Toronto, and Vancouver. The measured display in dollars sold (in thousands). These 3-D data are shown in the table. The 3-D data of the table are represented as a series of 2-D tables.
Conceptually, we may represent the same data in the form of 3-D data cubes, as shown in fig:
Let us suppose that we would like to view our sales data with an additional fourth dimension, such as a supplier.
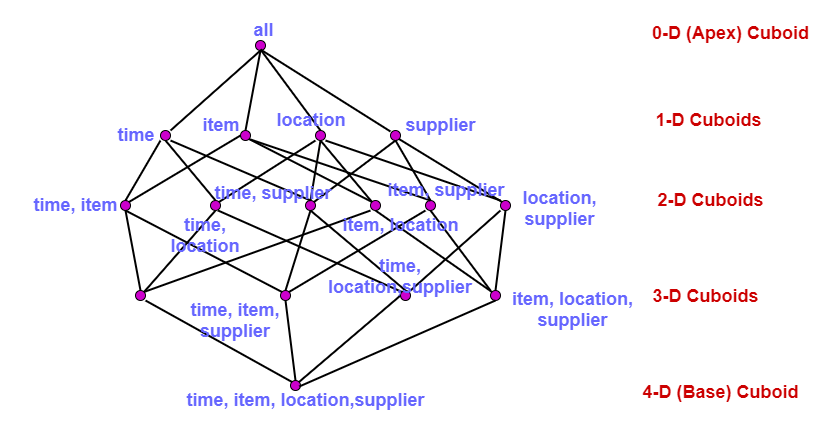
In data warehousing, the data cubes are n-dimensional. The cuboid which holds the lowest level of summarization is called a base cuboid.
For example, the 4-D cuboid in the figure is the base cuboid for the given time, item, location, and supplier dimensions.
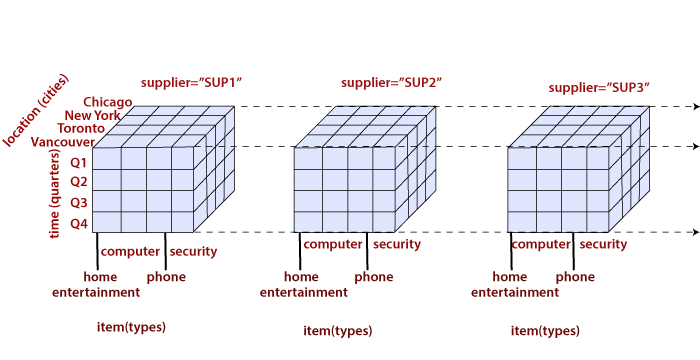
Figure is shown a 4-D data cube representation of sales data, according to the dimensions time, item, location, and supplier. The measure displayed is dollars sold (in thousands).
The topmost 0-D cuboid, which holds the highest level of summarization, is known as the apex cuboid. In this example, this is the total sales, or dollars sold, summarized over all four dimensions.
The lattice of cuboid forms a data cube. The figure shows the lattice of cuboids creating 4-D data cubes for the dimension time, item, location, and supplier. Each cuboid represents a different degree of summarization.
Data Preprocessing in Data Mining -A Hands On Guide
Data Preprocessing
Data preprocessing is the process of transforming raw data into an understandable format. It is also an important step in data mining as we cannot work with raw data. The quality of the data should be checked before applying machine learning or data mining algorithms.
Why is Data preprocessing important?
Preprocessing of data is mainly to check the data quality. The quality can be checked by the following
- Accuracy: To check whether the data entered is correct or not.
- Completeness: To check whether the data is available or not recorded.
- Consistency: To check whether the same data is kept in all the places that do or do not match.
- Timeliness: The data should be updated correctly.
- Believability: The data should be trustable.
- Interpretability: The understandability of the data.
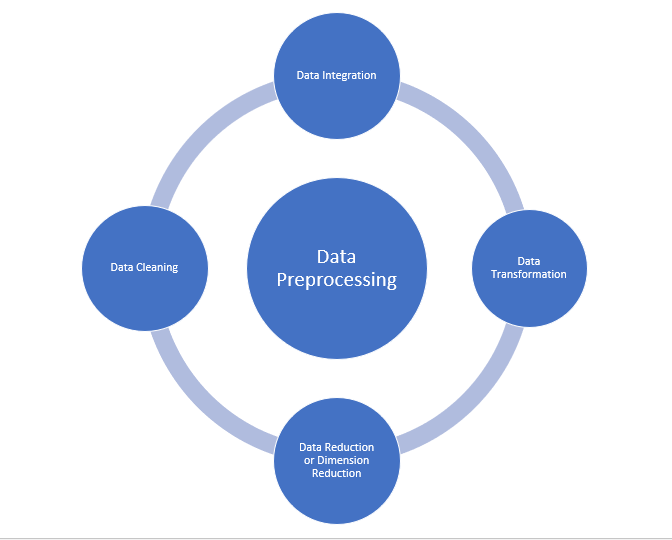
Major Tasks in Data Preprocessing:
- Data cleaning
- Data integration
- Data reduction
- Data transformation
Data cleaning:
Data cleaning is the process to remove incorrect data, incomplete data and inaccurate data from the datasets, and it also replaces the missing values. There are some techniques in data cleaning
Handling missing values:
- Standard values like “Not Available” or “NA” can be used to replace the missing values.
- Missing values can also be filled manually but it is not recommended when that dataset is big.
- The attribute’s mean value can be used to replace the missing value when the data is normally distributed
wherein in the case of non-normal distribution median value of the attribute can be used. - While using regression or decision tree algorithms the missing value can be replaced by the most probable
value.
Noisy:
Noisy generally means random error or containing unnecessary data points. Here are some of the methods to handle noisy data.
- Binning: This method is to smooth or handle noisy data. First, the data is sorted then and then the sorted values are separated and stored in the form of bins. There are three methods for smoothing data in the bin. Smoothing by bin mean method: In this method, the values in the bin are replaced by the mean value of the bin; Smoothing by bin median: In this method, the values in the bin are replaced by the median value; Smoothing by bin boundary: In this method, the using minimum and maximum values of the bin values are taken and the values are replaced by the closest boundary value.
- Regression: This is used to smooth the data and will help to handle data when unnecessary data is present. For the analysis, purpose regression helps to decide the variable which is suitable for our analysis.
- Clustering: This is used for finding the outliers and also in grouping the data. Clustering is generally used in unsupervised learning.
Data integration:
The process of combining multiple sources into a single dataset. The Data integration process is one of the main components in data management. There are some problems to be considered during data integration.
- Schema integration: Integrates metadata(a set of data that describes other data) from different sources.
- Entity identification problem: Identifying entities from multiple databases. For example, the system or the use should know student _id of one database and student_name of another database belongs to the same entity.
- Detecting and resolving data value concepts: The data taken from different databases while merging may differ. Like the attribute values from one database may differ from another database. For example, the date format may differ like “MM/DD/YYYY” or “DD/MM/YYYY”.
Data reduction:
This process helps in the reduction of the volume of the data which makes the analysis easier yet produces the same or almost the same result. This reduction also helps to reduce storage space. There are some of the techniques in data reduction are Dimensionality reduction, Numerosity reduction, Data compression.
- Dimensionality reduction: This process is necessary for real-world applications as the data size is big. In this process, the reduction of random variables or attributes is done so that the dimensionality of the data set can be reduced. Combining and merging the attributes of the data without losing its original characteristics. This also helps in the reduction of storage space and computation time is reduced. When the data is highly dimensional the problem called “Curse of Dimensionality” occurs.
- Numerosity Reduction: In this method, the representation of the data is made smaller by reducing the volume. There will not be any loss of data in this reduction.
- Data compression: The compressed form of data is called data compression. This compression can be lossless or lossy. When there is no loss of information during compression it is called lossless compression. Whereas lossy compression reduces information but it removes only the unnecessary information.
Data Transformation:
The change made in the format or the structure of the data is called data transformation. This step can be simple or complex based on the requirements. There are some methods in data transformation.
- Smoothing: With the help of algorithms, we can remove noise from the dataset and helps in knowing the important features of the dataset. By smoothing we can find even a simple change that helps in prediction.
- Aggregation: In this method, the data is stored and presented in the form of a summary. The data set which is from multiple sources is integrated into with data analysis description. This is an important step since the accuracy of the data depends on the quantity and quality of the data. When the quality and the quantity of the data are good the results are more relevant.
- Discretization: The continuous data here is split into intervals. Discretization reduces the data size. For example, rather than specifying the class time, we can set an interval like (3 pm-5 pm, 6 pm-8 pm).
- Normalization: It is the method of scaling the data so that it can be represented in a smaller range. Example ranging from -1.0 to 1.0.
Data preprocessing steps in machine learning
Import libraries and the dataset
import pandas as pd
import numpy as np
dataset = pd.read_csv('Datasets.csv')
print (data_set)
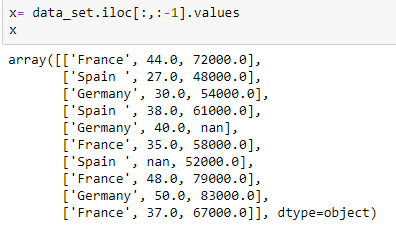
Extracting independent variable:
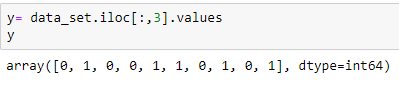
Extracting dependent variable:
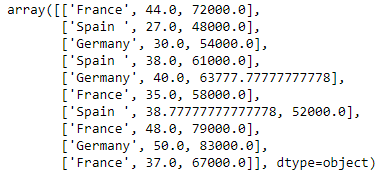
Filling the dataset with the mean value of the attribute
from sklearn.preprocessing import Imputer
imputer= Imputer(missing_values ='NaN', strategy='mean', axis = 0)
imputerimputer= imputer.fit(x[:, 1:3])
x[:, 1:3]= imputer.transform(x[:, 1:3])
x
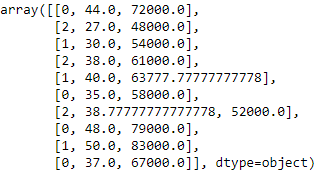
Encoding the country variable
The machine learning models use mathematical equations. So categorical data is not accepted so we convert it into numerical form.
from sklearn.preprocessing import LabelEncoder
label_encoder_x= LabelEncoder()
x[:, 0]= label_encoder_x.fit_transform(x[:, 0])
Dummy encoding
These dummy variables replace the categorical data as 0 and 1 in the absence or the presence of the specific categorical data.
Encoding for Purchased variable
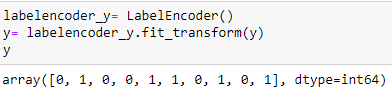
labelencoder_y= LabelEncoder()
y= labelencoder_y.fit_transform(y)
Splitting the dataset into training and test set:
 from sklearn.model_selection import train_test_split
x_train, x_test, y_train, y_test= train_test_split(x, y, test_size= 0.2, random_state=0)
Feature Scaling
from sklearn.preprocessing import StandardScaler
st_x= StandardScaler()
x_train= st_x.fit_transform(x_train)
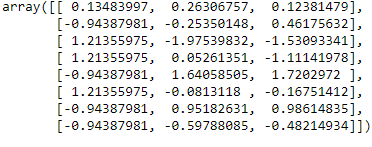
x_test= st_x.transform(x_test)
Conclusion:
In this article, I have explained about the most crucial step in Machine learning is data preprocessing. I hope this article gives you a better understanding of the concept.
Vedio Link CO2 :
vedio Link CO4:
STAY TUNED FOR UPDATES!!!!
Extra-ordinary work guys...
ReplyDeleteReally happy after seeing the stuff.